In the Google graph online information there is also this :
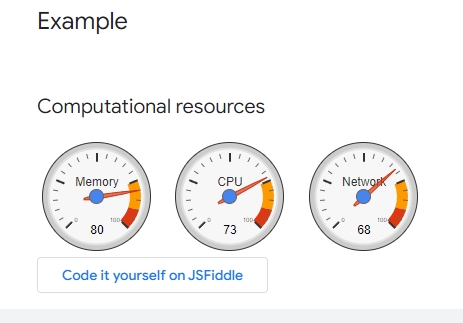
Can it be added to the FWH Lib ? Mr. Navaro ?
https://developers.google.com/chart/int ... lery/gauge
www.FiveTechSoft.com
![]() by Marc Venken » Tue Feb 20, 2024 8:38 pm
by Marc Venken » Tue Feb 20, 2024 8:38 pm

![]() by Antonio Linares » Tue Feb 20, 2024 8:46 pm
by Antonio Linares » Tue Feb 20, 2024 8:46 pm
// Please install https://developer.microsoft.com/en-us/m ... /webview2/ x86 version before using it

#include "FiveWin.ch"

function Main()

   local oWebView := TWebView():New()

   oWebView:SetHtml( Html() )
   oWebView:SetTitle( "Google charts" )
   oWebView:SetSize( 1200, 800 )
   oWebView:SetUserAgent( "Mozilla/5.0 (Linux; Android 6.0; Nexus 5 Build/MRA58N) AppleWebKit/537.36 (KHTML, like Gecko) Chrome/103.0.5060.53 Mobile Safari/537.36" )
   sleep( 300 )
   oWebView:Run()
   oWebView:Destroy()

return nil

function Html()

   local cHtml

   TEXT INTO cHtml
   <html>
   <head>
    <script type="text/javascript" src="https://www.gstatic.com/charts/loader.js"></script>
    <script type="text/javascript">
       google.charts.load('current', {'packages':['gauge']});
       google.charts.setOnLoadCallback(drawChart);

       function drawChart() {

         var data = google.visualization.arrayToDataTable([
           ['Label', 'Value'],
           ['Memory', 80],
           ['CPU', 55],
           ['Network', 68]
         ]);

         var options = {
           width: 400, height: 120,
           redFrom: 90, redTo: 100,
           yellowFrom:75, yellowTo: 90,
           minorTicks: 5
         };

         var chart = new google.visualization.Gauge(document.getElementById('chart_div'));

         chart.draw(data, options);

         setInterval(function() {
           data.setValue(0, 1, 40 + Math.round(60 * Math.random()));
           chart.draw(data, options);
         }, 13000);
         setInterval(function() {
           data.setValue(1, 1, 40 + Math.round(60 * Math.random()));
           chart.draw(data, options);
         }, 5000);
         setInterval(function() {
           data.setValue(2, 1, 60 + Math.round(20 * Math.random()));
           chart.draw(data, options);
         }, 26000);
       }
     </script>
   </head>
   <body>
     <div id="chart_div" style="width: 400px; height: 120px;"></div>
   </body>
   </html>
   ENDTEXT

return cHtml

![]() by Marc Venken » Tue Feb 20, 2024 9:22 pm
by Marc Venken » Tue Feb 20, 2024 9:22 pm
![]() by Antonio Linares » Tue Feb 20, 2024 10:04 pm
by Antonio Linares » Tue Feb 20, 2024 10:04 pm
#include "FiveWin.ch"

function Main()

   local oDlg, oWebView

   DEFINE DIALOG oDlg TITLE "Google charts"

   ACTIVATE DIALOG oDlg CENTERED ;
      ON INIT ( oWebView := TWebView():New(, oDlg:hWnd ), oWebView:SetSize( 800, 600 ),;
                oWebView:SetHtml( Html() ) ) ;
      VALID ( oWebView:Terminate(), oWebView:Destroy(), .T. )

return nil

function Html()

   local cHtml

   TEXT INTO cHtml
   <html>
   <head>
    <script type="text/javascript" src="https://www.gstatic.com/charts/loader.js"></script>
    <script type="text/javascript">
       google.charts.load('current', {'packages':['gauge']});
       google.charts.setOnLoadCallback(drawChart);

       function drawChart() {

         var data = google.visualization.arrayToDataTable([
           ['Label', 'Value'],
           ['Memory', 80],
           ['CPU', 55],
           ['Network', 68]
         ]);

         var options = {
           width: 400, height: 120,
           redFrom: 90, redTo: 100,
           yellowFrom:75, yellowTo: 90,
           minorTicks: 5
         };

         var chart = new google.visualization.Gauge(document.getElementById('chart_div'));

         chart.draw(data, options);

         setInterval(function() {
           data.setValue(0, 1, 40 + Math.round(60 * Math.random()));
           chart.draw(data, options);
         }, 13000);
         setInterval(function() {
           data.setValue(1, 1, 40 + Math.round(60 * Math.random()));
           chart.draw(data, options);
         }, 5000);
         setInterval(function() {
           data.setValue(2, 1, 60 + Math.round(20 * Math.random()));
           chart.draw(data, options);
         }, 26000);
       }
     </script>
   </head>
   <body>
     <div id="chart_div" style="width: 400px; height: 120px;"></div>
   </body>
   </html>
   ENDTEXT

return cHtml![]() by Marc Venken » Tue Feb 20, 2024 10:08 pm
by Marc Venken » Tue Feb 20, 2024 10:08 pm
![]() by Antonio Linares » Tue Feb 20, 2024 10:12 pm
by Antonio Linares » Tue Feb 20, 2024 10:12 pm
![]() by Marc Venken » Wed Feb 21, 2024 10:32 am
by Marc Venken » Wed Feb 21, 2024 10:32 am
#include "FiveWin.ch"

#Define CLR_ORANGE     nRGB( 255, 165, 000 )

function Main()

   local oDlg, oWebView, oBrush, oWnd, oMain
   local aData, oBtn1

   //DEFINE BRUSH oBrush FILE "arduino2.jpg" RESIZE
   DEFINE BRUSH oBrush FILE "..\bitmaps\backgrnd\iosbg.bmp" RESIZE
   //DEFINE BRUSH oBrush COLOR RGB( 77, 99, 110 )

   DEFINE DIALOG oDlg WINDOW oMain SIZE 1400,900 PIXEL TRUEPIXEL TITLE "Google charts" BRUSH oBrush

   //  These says are done because I don't find the transparant clause for the gauges yet.
   //
They simple make a region transparent
   @ 1,  1 SAY " " OF oDlg SIZE 1400, 380 PIXEL COLORS CLR_ORANGE, CLR_WHITE TRANSPARENT UPDATE
   @ 380,  1 SAY " " OF oDlg SIZE 470, 520 PIXEL COLORS CLR_ORANGE, CLR_WHITE TRANSPARENT UPDATE
   @ 380,  950 SAY " " OF oDlg SIZE 700, 520 PIXEL COLORS CLR_ORANGE, CLR_WHITE TRANSPARENT UPDATE
   @ 520,  1 SAY " " OF oDlg SIZE 1400, 900 PIXEL COLORS CLR_ORANGE, CLR_WHITE TRANSPARENT UPDATE

   @ 15,  400 SAY "&Servo 1:" OF oDlg SIZE 100, 25 PIXEL COLORS CLR_ORANGE, CLR_WHITE TRANSPARENT UPDATE
   @ 60,  400 BTNBMP oBtn1 OF oDlg SIZE 100, 40 NOBORDER PROMPT "Run Data" 2007 ACTION rundata(oDlg)

   RunXBrowser(oDlg)

   ACTIVATE DIALOG oDlg CENTERED ;
      ON INIT ( oWebView := TWebView():New(, oDlg:hWnd ), oWebView:SetSize( 1400, 900 ),;
                oWebView:SetHtml( Html() ) ) ;
      VALID ( oWebView:Terminate(), oWebView:Destroy(), .T. )

return nil

function Html()

   local cHtml

   TEXT INTO cHtml
   <html>
   <head>
   <style>
     body {
      display: flex;
      align-items: center;
      justify-content: center;
      height: 100vh;
      background-color: #004e5766;
      font-family: Arial, sans-serif;
      margin: 0;
     padding: 0;
    }

      .container {
         max-width: 400px;
         margin: 0 auto;
         padding: 40px;
         background-color: #FFFFFF;  //00FFFFFF is not transparent
         border-radius: 5px;
         display: flex;
         flex-direction: column;
         align-items: center;
         box-shadow: 0px 0px 44px rgba(0, 0, 0, 0.7) !important;
         overflow:none !important;
       }

       body {
         background-color: #4d636e;
       }

     </style>

    <script type="text/javascript" src="https://www.gstatic.com/charts/loader.js"></script>
    <script type="text/javascript">
       google.charts.load('current', {'packages':['gauge']});
       google.charts.setOnLoadCallback(drawChart);

       function drawChart() {

         var data = google.visualization.arrayToDataTable([
           ['Label', 'Value'],
           ['Memory', 80],
           ['CPU', 55],
           ['Network', 68]
         ]);

         var options = {
           width: 400, height: 120,
           redFrom: 90, redTo: 100,
           yellowFrom:75, yellowTo: 90,
           minorTicks: 5
         };

         var chart = new google.visualization.Gauge(document.getElementById('chart_div'));

         chart.draw(data, options);

         setInterval(function() {
           data.setValue(0, 1, 40 + Math.round(60 * Math.random()));
           chart.draw(data, options);
         }, 1000);
         setInterval(function() {
           data.setValue(1, 1, 40 + Math.round(60 * Math.random()));
           chart.draw(data, options);
         }, 2000);
         setInterval(function() {
           data.setValue(2, 1, 60 + Math.round(20 * Math.random()));
           chart.draw(data, options);
         }, 2500);
       }
     </script>
   </head>
   <body background="c:\fwharb\samples\arduino2.jpg">
     <div id="chart_div" style="width: 400px; height: 120px;"></div>
   </body>
   </html>
   ENDTEXT

return cHtml

function runXbrowser(oDlg)

   local oFont, oBrw, oData, oBrushBrw


   DBCREATE( "TEST", {  {  "PROG",    "C", 7, 0 } ;
                     ,  {  "Num",  "N", 5, 0 } ;
                     ,  {  "SER0", "N", 5, 0 } ;
                     ,  {  "SER1",   "N", 5, 0 } ;
                     ,  {  "SER2",  "N", 5, 0 } ;
                     }, "DBFCDX", .T., "TST" )

   FW_ArrayToDBF( { { "MOV",1,40,60,70 }, { "MOV",2,60,80,90 }, { "MOV",3,10,15,25 } } )

   CLOSE TST

   // Created
   DEFINE BRUSH oBrushBrw COLOR RGB( 192, 192, 192 )

   USE TEST SHARED NEW

   DEFINE FONT oFont NAME "TAHOMA" SIZE 0,-14

   @ 120,400 XBROWSE oBrw SIZE 400,200 PIXEL OF oDlg ;
      DATASOURCE "TEST" COLUMNS "PROG", "NUM", "SER0", "SER1", "SER2" ;
      HEADERS nil, nil, nil, nil, nil ;
      COLSIZES 80, 70, 70, 70, 70 ;
      CELL LINES NOBORDER TRANSPARENT

   WITH OBJECT oBrw
      :nStretchCol   := 1
      :nRowHeight    := 20
      :CreateFromCode()
   END
   WITH object oBrw:aCols[3]
      :nEditType := EDIT_GET
      :cEditPicture := "999"
      :lAutoSave := .T.
   end

return nil

function rundata(oDlg)
   msginfo("I hope Mr. Antonio will be so kind to show the code to update the Xbrowse data and show them in the 3 gauges")
return NIL
![]() by Antonio Linares » Wed Feb 21, 2024 10:44 am
by Antonio Linares » Wed Feb 21, 2024 10:44 am
![]() by Antonio Linares » Wed Feb 21, 2024 12:33 pm
by Antonio Linares » Wed Feb 21, 2024 12:33 pm
![]() by Marc Venken » Wed Feb 21, 2024 1:42 pm
by Marc Venken » Wed Feb 21, 2024 1:42 pm
![]() by Antonio Linares » Wed Feb 21, 2024 2:18 pm
by Antonio Linares » Wed Feb 21, 2024 2:18 pm
#include "FiveWin.ch"
#Define CLR_ORANGE nRGB( 255, 165, 000 )
extern dbfcdx
function Main()
local oDlg, oWebView, oBrush
local oBtn1, oPanel
DEFINE BRUSH oBrush FILE "..\bitmaps\backgrnd\iosbg.bmp"
DEFINE DIALOG oDlg SIZE 1200, 800 PIXEL TRUEPIXEL TITLE "Google charts" BRUSH oBrush
@ 1, 1 SAY " " OF oDlg SIZE 1400, 380 PIXEL COLORS CLR_ORANGE, CLR_WHITE TRANSPARENT UPDATE
@ 380, 1 SAY " " OF oDlg SIZE 470, 520 PIXEL COLORS CLR_ORANGE, CLR_WHITE TRANSPARENT UPDATE
@ 380, 950 SAY " " OF oDlg SIZE 700, 520 PIXEL COLORS CLR_ORANGE, CLR_WHITE TRANSPARENT UPDATE
@ 520, 1 SAY " " OF oDlg SIZE 1400, 900 PIXEL COLORS CLR_ORANGE, CLR_WHITE TRANSPARENT UPDATE
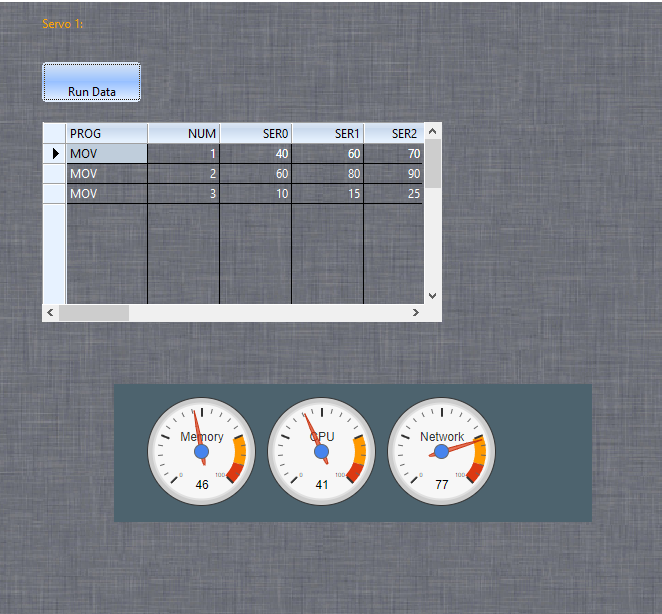
@ 15, 400 SAY "&Servo 1:" OF oDlg SIZE 100, 25 PIXEL COLORS CLR_ORANGE, CLR_WHITE TRANSPARENT UPDATE
@ 60, 400 BTNBMP oBtn1 OF oDlg SIZE 100, 40 NOBORDER PROMPT "Run Data" 2007 ;
ACTION oWebView:Eval( "Update( 50, 70, 90 );" )
@ 400, 300 PANEL oPanel OF oDlg SIZE 630, 230
RunXBrowser( oDlg )
ACTIVATE DIALOG oDlg CENTERED ;
ON INIT ( oWebView := TWebView():New(), oWebView:SetHtml( Html() ), oWebView:SetParent( oPanel ) ) ;
VALID ( oWebView:Terminate(), oWebView:Destroy(), .T. )
return nil
function Html()
local cHtml
TEXT INTO cHtml
<html>
<head>
<style>
body {
display: flex;
align-items: center;
justify-content: center;
height: 100vh;
background-color: #004e5766;
font-family: Arial, sans-serif;
margin: 0;
padding: 0;
}
.container {
max-width: 400px;
margin: 0 auto;
padding: 40px;
background-color: #FFFFFF; //00FFFFFF is not transparent
border-radius: 5px;
display: flex;
flex-direction: column;
align-items: center;
box-shadow: 0px 0px 44px rgba(0, 0, 0, 0.7) !important;
overflow:none !important;
}
body {
background-color: #4d636e;
}
</style>
<script type="text/javascript" src="https://www.gstatic.com/charts/loader.js"></script>
<script type="text/javascript">
google.charts.load('current', {'packages':['gauge']});
var options = {
width: 400, height: 120,
redFrom: 90, redTo: 100,
yellowFrom:75, yellowTo: 90,
minorTicks: 5
};
var chart;
var data;
google.charts.setOnLoadCallback(drawChart);
function drawChart() {
chart = new google.visualization.Gauge(document.getElementById('chart_div'));
data = google.visualization.arrayToDataTable([
['Label', 'Value'],
['Memory', 80],
['CPU', 55],
['Network', 68] ] );
chart.draw(data, options);
}
function Update( a, b, c ) {
data.setValue( 0, 1, a );
data.setValue( 1, 1, b );
data.setValue( 2, 1, c );
chart.draw( data, options );
}
</script>
</head>
<body background="c:\fwharb\samples\arduino2.jpg">
<div id="chart_div" style="width: 400px; height: 120px;"></div>
</body>
</html>
ENDTEXT
return cHtml
function runXbrowser(oDlg)
local oFont, oBrw, oData, oBrushBrw
DBCREATE( "TEST", { { "PROG", "C", 7, 0 } ;
, { "Num", "N", 5, 0 } ;
, { "SER0", "N", 5, 0 } ;
, { "SER1", "N", 5, 0 } ;
, { "SER2", "N", 5, 0 } ;
}, "DBFCDX", .T., "TST" )
FW_ArrayToDBF( { { "MOV",1,40,60,70 }, { "MOV",2,60,80,90 }, { "MOV",3,10,15,25 } } )
CLOSE TST
// Created
DEFINE BRUSH oBrushBrw COLOR RGB( 192, 192, 192 )
USE TEST SHARED NEW
DEFINE FONT oFont NAME "TAHOMA" SIZE 0,-14
@ 120,400 XBROWSE oBrw SIZE 400,200 PIXEL OF oDlg ;
DATASOURCE "TEST" COLUMNS "PROG", "NUM", "SER0", "SER1", "SER2" ;
HEADERS nil, nil, nil, nil, nil ;
COLSIZES 80, 70, 70, 70, 70 ;
CELL LINES NOBORDER TRANSPARENT
WITH OBJECT oBrw
:nStretchCol := 1
:nRowHeight := 20
:CreateFromCode()
END
WITH object oBrw:aCols[3]
:nEditType := EDIT_GET
:cEditPicture := "999"
:lAutoSave := .T.
end
return nil![]() by Marc Venken » Wed Feb 21, 2024 7:56 pm
by Marc Venken » Wed Feb 21, 2024 7:56 pm
#include "FiveWin.ch"

#Define CLR_ORANGE     nRGB( 255, 165, 000 )

extern dbfcdx

function Main()

   local oDlg, oWebView, oBrush
   local oBtn1, oBtn2, oBtn3, oPanel

   DEFINE BRUSH oBrush FILE "..\bitmaps\backgrnd\iosbg.bmp"

   DEFINE DIALOG oDlg SIZE 1200, 800 PIXEL TRUEPIXEL TITLE "Google charts" BRUSH oBrush

   @ 15,  400 SAY "&Servo 1:" OF oDlg SIZE 130, 25 PIXEL COLORS CLR_ORANGE, CLR_WHITE TRANSPARENT UPDATE

   @ 60,  400 BTNBMP oBtn1 OF oDlg SIZE 130, 40 NOBORDER PROMPT "Run Single Data" 2007 ;
      ACTION oWebView:Eval( "Update( 50, 70, 90 );" )

   @ 60,  600 BTNBMP oBtn2 OF oDlg SIZE 130, 40 NOBORDER PROMPT "Run XBrowse" 2007 ;
      ACTION runxbrdata(oWebView)

   @ 420, 350 PANEL oPanel OF oDlg SIZE 500, 200

   RunXBrowser( oDlg )

   ACTIVATE DIALOG oDlg CENTERED ;
      ON INIT ( oWebView := TWebView():New(), oWebView:SetHtml( Html() ), oWebView:SetParent( oPanel ) ) ;
      VALID ( oWebView:Terminate(), oWebView:Destroy(), .T. )

return nil

function Html()

   local cHtml

   TEXT INTO cHtml
   <html>
   <head>
   <style>
     body {
      display: flex;
      align-items: center;
      justify-content: center;
      height: 100vh;
      background-color: #004e5766;
      font-family: Arial, sans-serif;
      margin: 0;
     padding: 0;
    }

      .container {
         max-width: 400px;
         margin: 0 auto;
         padding: 40px;
         background-color: #FFFFFF;  //00FFFFFF is not transparent
         border-radius: 5px;
         display: flex;
         flex-direction: column;
         align-items: center;
         box-shadow: 0px 0px 44px rgba(0, 0, 0, 0.7) !important;
         overflow:none !important;
       }

       body {
         background-color: #4d636e;
       }

     </style>

    <script type="text/javascript" src="https://www.gstatic.com/charts/loader.js"></script>
    <script type="text/javascript">
       google.charts.load('current', {'packages':['gauge']});

      var options = {
         width: 400, height: 120,
         redFrom: 90, redTo: 100,
         yellowFrom:75, yellowTo: 90,
         minorTicks: 5
      };

      var chart;
      var data;

      google.charts.setOnLoadCallback(drawChart);

      function drawChart() {
         chart = new google.visualization.Gauge(document.getElementById('chart_div'));
         data = google.visualization.arrayToDataTable([
                  ['Label', 'Value'],
                  ['Memory', 80],
                  ['CPU', 55],
                  ['Network', 68] ] );
         chart.draw(data, options);
       }

      function Update( a, b, c ) {
         data.setValue( 0, 1, a );
         data.setValue( 1, 1, b );
         data.setValue( 2, 1, c );
         chart.draw( data, options );
      }
     </script>
   </head>
   <body background="c:\fwharb\samples\arduino2.jpg">
     <div id="chart_div" style="width: 400px; height: 120px;"></div>
   </body>
   </html>
   ENDTEXT

return cHtml

function runXbrowser(oDlg)

   local oFont, oBrw, oData, oBrushBrw


   DBCREATE( "TEST", {  {  "PROG",    "C", 7, 0 } ;
                     ,  {  "Num",  "N", 5, 0 } ;
                     ,  {  "SER0", "N", 5, 0 } ;
                     ,  {  "SER1",   "N", 5, 0 } ;
                     ,  {  "SER2",  "N", 5, 0 } ;
                     }, "DBFCDX", .T., "TST" )

   FW_ArrayToDBF( { { "MOV",1,40,60,70 }, { "MOV",2,60,80,90 }, { "MOV",3,10,15,25 } } )

   CLOSE TST

   // Created
   DEFINE BRUSH oBrushBrw COLOR RGB( 192, 192, 192 )

   USE TEST SHARED NEW

   DEFINE FONT oFont NAME "TAHOMA" SIZE 0,-14

   @ 120,400 XBROWSE oBrw SIZE 400,200 PIXEL OF oDlg ;
      DATASOURCE "TEST" COLUMNS "PROG", "NUM", "SER0", "SER1", "SER2" ;
      HEADERS nil, nil, nil, nil, nil ;
      COLSIZES 80, 70, 70, 70, 70 ;
      CELL LINES NOBORDER TRANSPARENT

   WITH OBJECT oBrw
      :nStretchCol   := 1
      :nRowHeight    := 20
      :CreateFromCode()
   END
   WITH object oBrw:aCols[3]
      :nEditType := EDIT_GET
      :cEditPicture := "999"
      :lAutoSave := .T.
   end

return nil


function runxbrdata(oWebView)
  local cData
  test->(dbgotop())
  do while !test->(eof())
    cData = 'Update( '+str(test->ser0,2)+','+str(test->ser1,2)+','+str(test->ser2,2)+')'
    oWebView:Eval( cData )
    test->(dbskip())
    sleep(3000)
  enddo
  test->(dbgotop())
return NIL
![]() by Antonio Linares » Thu Feb 22, 2024 4:53 am
by Antonio Linares » Thu Feb 22, 2024 4:53 am
![]() by Marc Venken » Thu Feb 22, 2024 11:30 am
by Marc Venken » Thu Feb 22, 2024 11:30 am
![]() by Marc Venken » Thu Feb 22, 2024 11:33 am
by Marc Venken » Thu Feb 22, 2024 11:33 am
Antonio Linares wrote:You can not mix FWH controls with TWebView
TWebView is just for HTML, etc
Keep them apart
Return to FiveWin for Harbour/xHarbour
Users browsing this forum: No registered users and 89 guests