James Bott wrote:I should clarify, in the beginning of this thread I was talking about making an x,y chart with just data points. This is also commonly called a scatter chart. For this type of chart the data points can be in any order. You can see a sample scatter chart here:
https://www.highcharts.com/docs/chart-and-series-types/scatter-chart
The line chart that TGraph has already, is a series chart where the X-axis data is in increasing order starting from the smallest point. An example might be temperature vs month-of-the-year. Here is a sample line chart:
https://www.highcharts.com/docs/chart-and-series-types/line-chart
Alvaro, which type of chart are you looking for? What type of data are you working with?
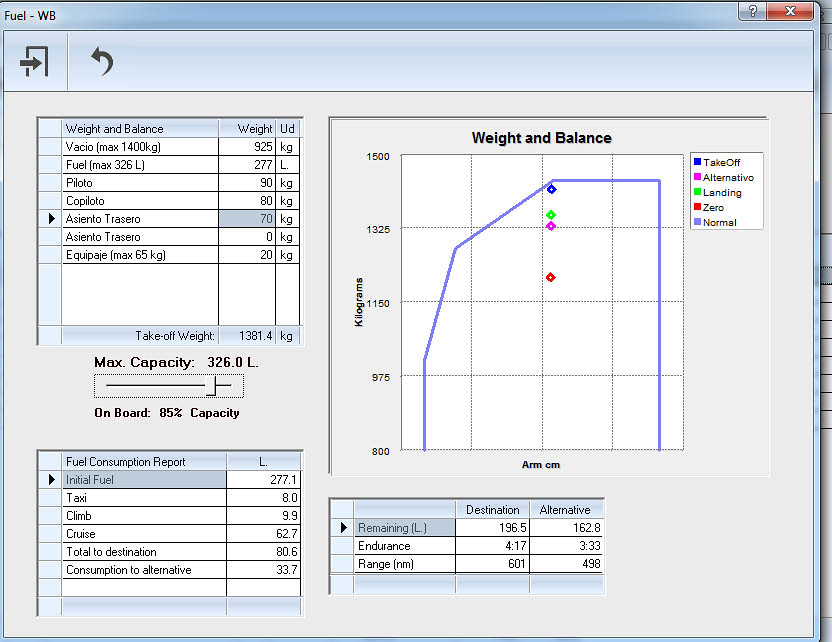
I did the first one, the "Scatter Chart". It's is already working. I have to finish minor changes. I will send it to you when finished. In my modified class you can choose between drawing individual points or drawing a line between points, in this case in the same order that the points have in the array, although the distance between x values may not be constant and may increase and decrease.
I forgot in my previous posts to credit the author of the excellent class, Alfredo Arteaga.
Regards,
Alvaro
A working example of the modified class

