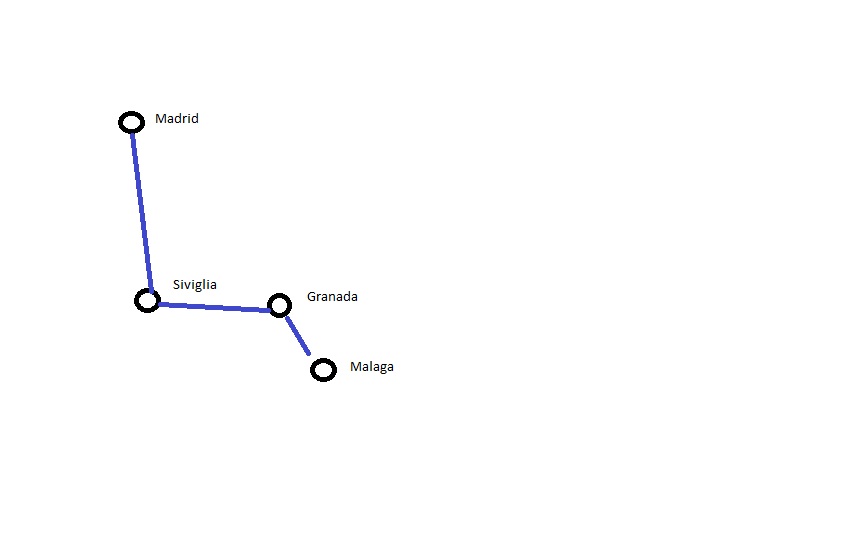
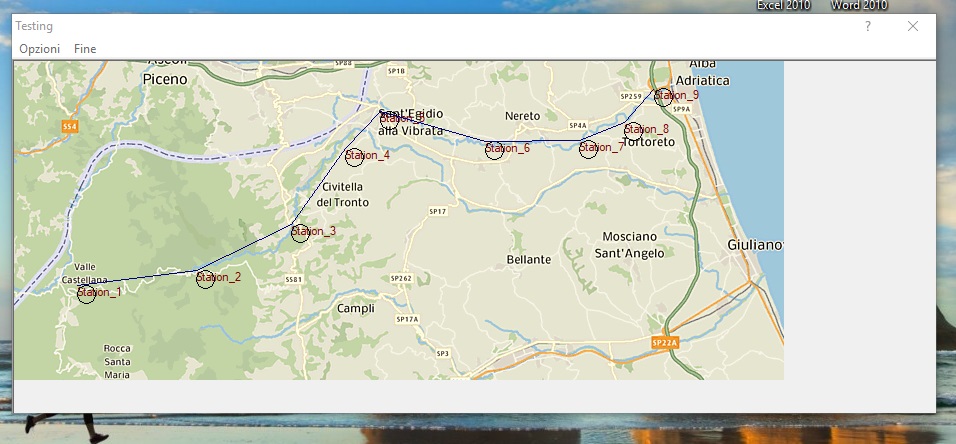
sample :
Madrid
Siviglia
Granada
Malaga
I wish create a graphic where there are circles and lines

on List of Cities
When I select one record on xbrowse for sample Madrid it must draw( fllodfill) on red color a circle of Madrid
on List of Busline ( where are the differences of Km from a cities to another )
When I select one reocrd on this list for a sample Madrid - Siviglia it must change color the line between Madrid and Siviglia
Any solution ?


