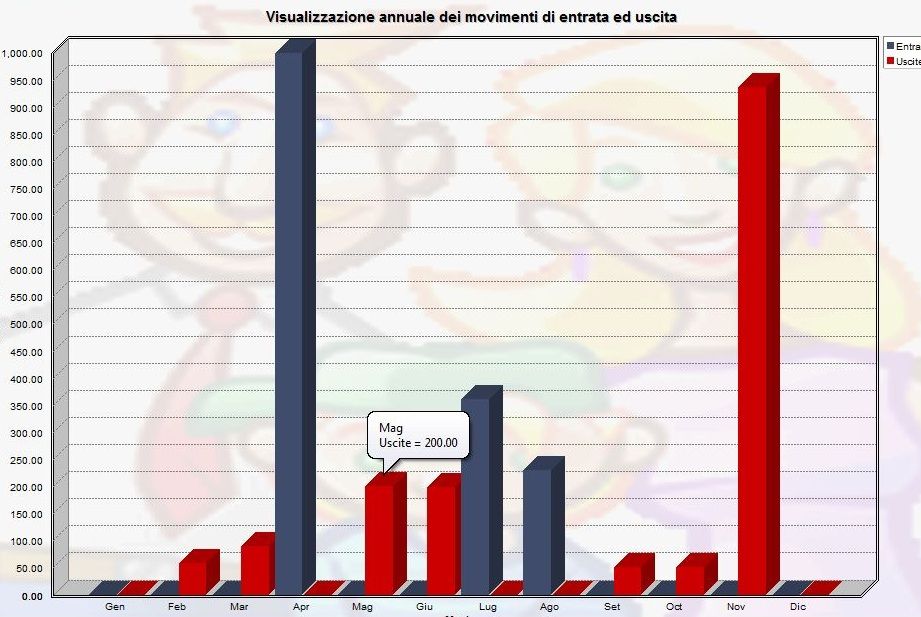
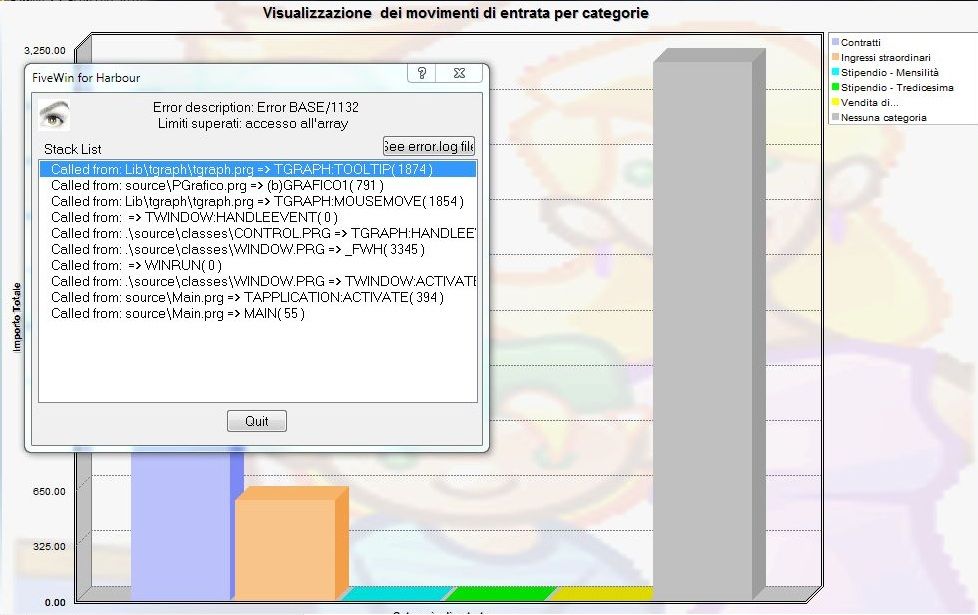
You need only to add the following DATA:
DATA aBarCoors
DATA lToolTip INIT .F.
The tooltip should display the X Legend and the Y Legend and Value
[url][url=http://postimage.org/]
 [/url]
 [/url]
oApp():oGraph:lToolTip := .t.

oApp():oGraph:cToolTip =  { | nAt, nSerie, nRow, nCol | nSerie := If( nAt % ;
                         Len( oApp():oGraph:aSeries ) == 0, Len( oApp():oGraph:aSeries ),;
                         Int( nAt % Len( oApp():oGraph:aSeries ) ) ),;
                         oApp():oGraph:ToolTip( nAt, nRow, nCol, nSerie) }


 [/url]
 oGraph:cToolTip = { | nAt, nSerie, nIndex | nSerie := If( nAt % ;
Len( oGraph:aSeries ) == 0, Len( oGraph:aSeries ),;
Int( nAt % Len( oGraph:aSeries ) ) ),;
"Series: " + Alltrim( Str( nSerie ) ) + CRLF + ;
"Bar: " + AllTrim( Str( nIndex := Int( nAt / Len( oGraph:aSeries ) ) + 1 + ;
If( nAt % Len( oGraph:aSeries ) == 0, -1, 0 ) ) ) + CRLF + ;
"Value: " + AllTrim( Str( oGraph:aData[ nSerie ][ nIndex ] ) ) }Return to FiveWin for Harbour/xHarbour
Users browsing this forum: Google [Bot], jair and 43 guests