Apart from once again I was unable to compile ER by downloading it from GitHub, if someone has compiled it with xmate if you can send me the compilation file because I really can't compile it
Since someone is forcing me to use EasyReport I have to understand and make all of you understand the problems to better solve them
Looking at the compiled version found in the Github folder, I have questions

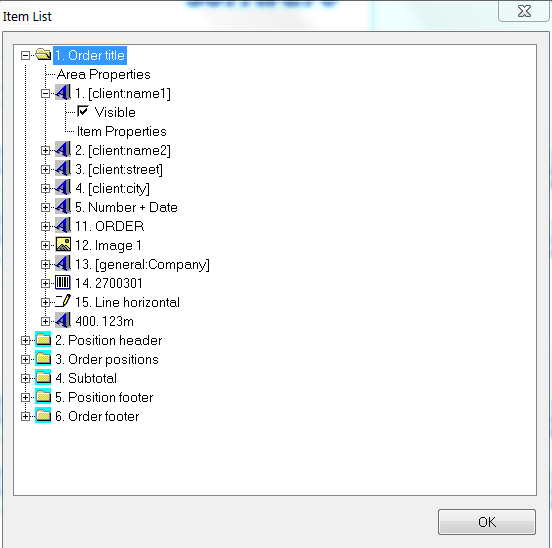
I'm seeing a folder with Report Setting, Items, Color and Font
I really don't understand why you created this folder in this location
Report settings
On last ER of Timm the Report Setting was on a speficif dialog

it seems to me that this dialog is more functional than the one in the main window because it is a topic that should not be used at the specific moment of designing the report model
Items
and in the same way the tree with all the objects in the old version could be called up from the buttonbar of the main window, so what is the use of keeping it in the folder you created?

Colors and Fonts
as for the colors and fonts I have to ask a question because I really don't understand the meaning
even in the old version it was in a specific dialog
https://i.postimg.cc/BbKpNV4d/fonts.png
to me a simple window with a buttonbar and with the designer seems to be more functional and nothing more
and put everything back in the original version as I showed you
for colors and fonts I really don't understand the meaning why you need to store up to 30 colors and 20 types of fonts?
the font and color may be loaded in the properties of each individual object
without memorizing it first and when I recover the object in print I am going to create the font for that object, I really don't understand the meaning why use a list of fonts and colors

for me this property needs to be changed
First Request
I assume that that folder (report settings, items, colors and fonts) has been put on a panel
we could put a button in the button bar to hide this panel
I have inserted this type of procedure in my applications and I show and hide the left panel in a simple way, this is because whoever has to draw the report has the free window
Second Request
if you really have to use this report designer at least is it possible to create a procedure in which I can have zoomed util 400% in on every area to work better?
the zoom must be as fastreport zoom so on 25% 50% 75% 100% 150% 200% page width full page
example

I think that in this way we can better draw every single area
Another question
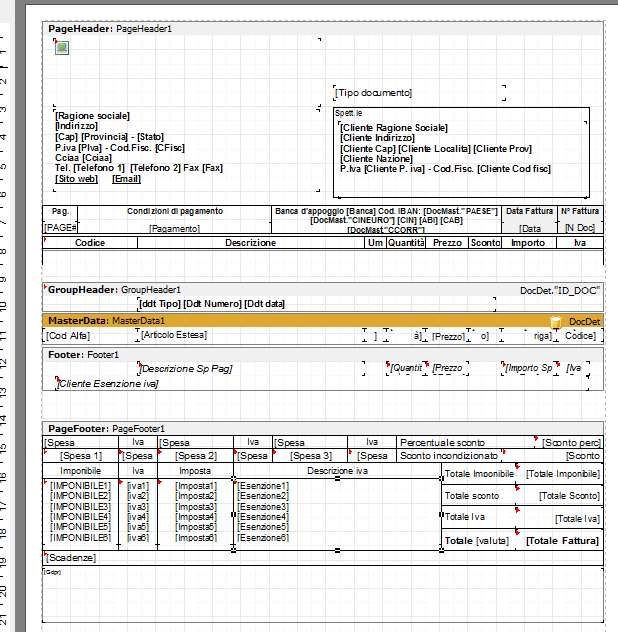
for a billing application I created this print with the Tprinter class (by hand @ x, y)
maybe you don't realize how much data we have to enter in Italy
invoices in Italy are a bit complex sample :

if we operated with EasyReport and had problems with the graphic controls because they don't work well we will spend many days
to make a model and this is counterproductive because in Italy we have many types of reports to do
