Plotting locations on Google Maps

User avatar
vilian
Posts: 985
Joined: Wed Nov 09, 2005 2:17 am
Location: Brazil
Contact:

Re: Plotting locations on Google Maps

Post by vilian »

In your previous sample, You are using the address to put the markers.

Code: Select all | Expand

  AAdd( aDatas, VerMapa2( "28850", "Calle Manuel Sandoval", "1", "Torrejon de Ardoz", "Madrid", "Spain" ) )


I need to do this using Latitude e longitude. I have this code that is working:

Code: Select all | Expand

STATIC FUNCTION ShowGoogleMap(aData)
LOCAL cHtmlContent1,cHtmlContent2, oOle, i,cMapFile
LOCAL cAppendStr:="var locations = ["+CRLF

   cMapFile:= RetArqTmp("htm")+".htm"
   FOR i:=1 to Len(aData)
       cAppendStr+=Space(4)+"['" +aData[i][1] +"',"+Ltrim(Str(aData[i][2]))+","+ Ltrim(Str(aData[i][3]))+ If( i < Len(aData), "],", "]") +CRLF
   NEXT
   cAppendStr+="];"+CRLF


   TEXT INTO cHtmlContent1

       <html>
       <head>

         <title>Google Maps Multiple Markers</title>
         <script src="http://maps.google.com/maps/api/js?sensor=false" type="text/javascript"></script>
       </head>
       <body>
         <div id="map" style="height: 100%; width: 100%;">
       </div>
       <script type="text/javascript">

   ENDTEXT


   TEXT INTO cHtmlContent2

        var map = new google.maps.Map(document.getElementById('map'), {
        zoom: 0,
         mapTypeId: google.maps.MapTypeId.ROADMAP
         });
        var bounds = new google.maps.LatLngBounds();
        var infowindow = new google.maps.InfoWindow();

        var marker, i;

       for (i = 0; i < locations.length; i++) {
            var position = new google.maps.LatLng(locations[i][1], locations[i][2]);
               bounds.extend(position);
               marker = new google.maps.Marker({
               position: new google.maps.LatLng(locations[i][1], locations[i][2]),
               title: locations[i][0],
               map: map
         });

         google.maps.event.addListener(marker, 'click', (function(marker, i) {
         return function() {
         infowindow.setContent(locations[i][0]);
         infowindow.open(map, marker);
         }
         })(marker, i));

         // Automatically center the map fitting all markers on the screen
         map.fitBounds(bounds);

       }
     </script>
     </body>
     </html>

   ENDTEXT


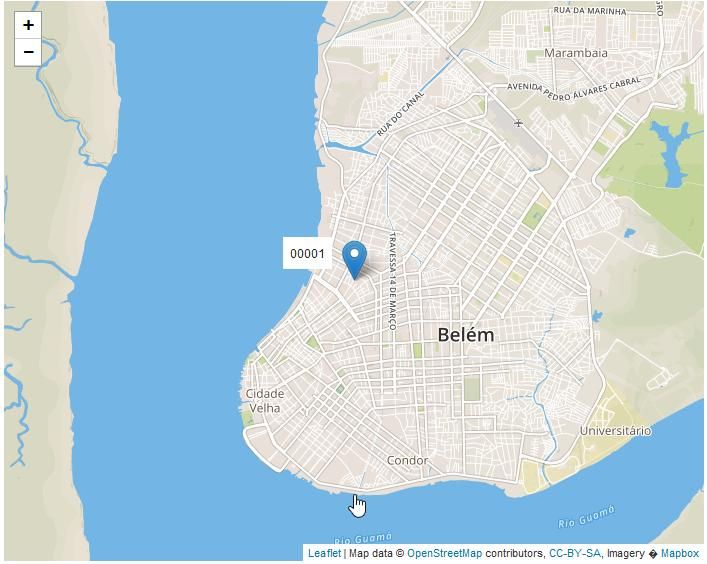
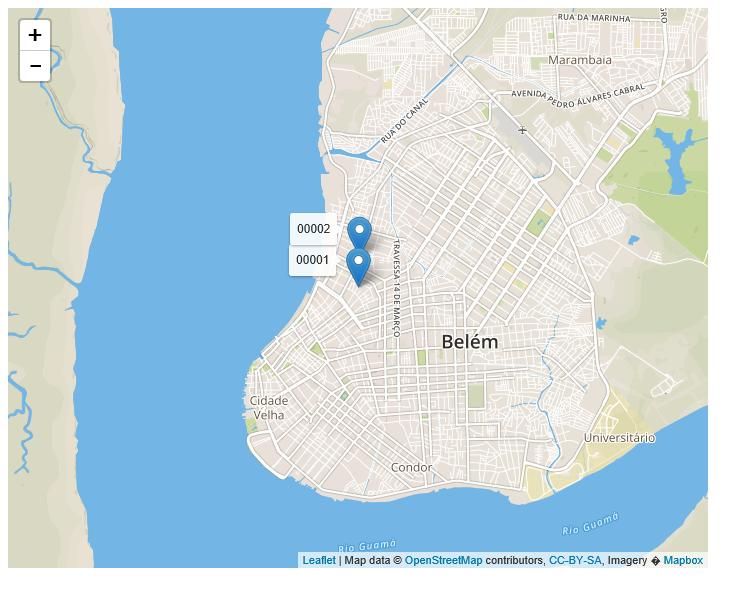
However, I only can see the titles of the markers if I click over them.
Sds,
Vilian F. Arraes
vilian@vfatec.com.br
Belém-Pa-Brazil
User avatar
cnavarro
Posts: 6557
Joined: Wed Feb 15, 2012 8:25 pm
Location: España
Been thanked: 3 times

Re: Plotting locations on Google Maps

Post by cnavarro »

Please look function in my sample

viewtopic.php?f=3&t=33729&start=15#p199586

and uncomment line

// XBrowse(


My function VerMapa2, return lat and long and other data
Use only position 2 and 3 of array aData
Cristobal Navarro
Hay dos tipos de personas: las que te hacen perder el tiempo y las que te hacen perder la noción del tiempo
El secreto de la felicidad no está en hacer lo que te gusta, sino en que te guste lo que haces
User avatar
cnavarro
Posts: 6557
Joined: Wed Feb 15, 2012 8:25 pm
Location: España
Been thanked: 3 times

Re: Plotting locations on Google Maps

Post by cnavarro »

I think I have not understood him well yet

If you have lat and long, Pass the array with that data to the function

ViewLeafLet( aDatas )
Cristobal Navarro
Hay dos tipos de personas: las que te hacen perder el tiempo y las que te hacen perder la noción del tiempo
El secreto de la felicidad no está en hacer lo que te gusta, sino en que te guste lo que haces
User avatar
vilian
Posts: 985
Joined: Wed Nov 09, 2005 2:17 am
Location: Brazil
Contact:

Re: Plotting locations on Google Maps

Post by vilian »

Cnavarro,

Thank you it's working now ;)
Why the map is not growing when we maximize the window? Is it possible?
Sds,
Vilian F. Arraes
vilian@vfatec.com.br
Belém-Pa-Brazil
User avatar
cnavarro
Posts: 6557
Joined: Wed Feb 15, 2012 8:25 pm
Location: España
Been thanked: 3 times

Re: Plotting locations on Google Maps

Post by cnavarro »

Try with TActiveX, have a data ::oWnd
Cristobal Navarro
Hay dos tipos de personas: las que te hacen perder el tiempo y las que te hacen perder la noción del tiempo
El secreto de la felicidad no está en hacer lo que te gusta, sino en que te guste lo que haces
User avatar
vilian
Posts: 985
Joined: Wed Nov 09, 2005 2:17 am
Location: Brazil
Contact:

Re: Plotting locations on Google Maps

Post by vilian »

I tried this:

Code: Select all | Expand

   
  DEFINE WINDOW oWndEdt
 
      oAct:=TActiveX():New(oWndEdt,"Shell.Explorer.2")
       oWndEdt:oClient = oAct

   ACTIVATE WINDOW oWndEdt MAXIMIZED;  ;
       VALID (lCancela:=.t.)

       oAct:Navigate(cMapFile)


However, when I changed to this, only the first mark is shown, and I have severals marks.
Sds,
Vilian F. Arraes
vilian@vfatec.com.br
Belém-Pa-Brazil
User avatar
cnavarro
Posts: 6557
Joined: Wed Feb 15, 2012 8:25 pm
Location: España
Been thanked: 3 times

Re: Plotting locations on Google Maps

Post by cnavarro »

Try in clausule ON INIT of oWndEdt -> oAct:Navigate(cMapFile)

Also try in clausule ON PAINT
Cristobal Navarro
Hay dos tipos de personas: las que te hacen perder el tiempo y las que te hacen perder la noción del tiempo
El secreto de la felicidad no está en hacer lo que te gusta, sino en que te guste lo que haces
User avatar
vilian
Posts: 985
Joined: Wed Nov 09, 2005 2:17 am
Location: Brazil
Contact:

Re: Plotting locations on Google Maps

Post by vilian »

With ActiveX I have this screen:
Image

With exactly the same code, but changing for show with createobject, I have this screen:

Image
Sds,
Vilian F. Arraes
vilian@vfatec.com.br
Belém-Pa-Brazil
User avatar
cnavarro
Posts: 6557
Joined: Wed Feb 15, 2012 8:25 pm
Location: España
Been thanked: 3 times

Re: Plotting locations on Google Maps

Post by cnavarro »

Try

Code: Select all | Expand


   MEMOWRIT( cMapFile, cHtmlContent1 + cInitMap + cHtmlContent2 + cAppendStr + cHtmlContent3 )
   CreaWin( cMapFile )

   /*
   oOle := CreateObject( "InternetExplorer.Application" )
   //oOle:bOnEvent  := { | n1, n2, n3 | LeafLetEvent( n1, n2, n3 ) }
   oOle:Width     := 750
   oOle:Height    := 650
   oOle:Visible   := .T.     // Displays the Browser
   oOle:ToolBar   := .F.     // Disables the toolbar
   oOle:StatusBar := .F.     // Disables status bar
   oOle:MenuBar   := .F.     // Disables the menu bar
   oOle:Navigate( cMapFile ) // Open the Webpage
   SysRefresh()
   */

Return nil

//----------------------------------------------------------------------------//

Function CreaWin( cMapFile )

   local oWnd
   local oAct
   local lCancela := .F.
   DEFINE WINDOW oWnd
 
   ACTIVATE WINDOW oWnd MAXIMIZED  ;
       VALID ( lCancela:=.t., .T. ) ;
       ON INIT ( ;
          oAct    := TActiveX():New( oWnd, "Shell.Explorer.2"), ;
          oWnd:oClient := oAct, ;
          oAct:Navigate( cMapFile ), SysRefresh() )

Return nil

//----------------------------------------------------------------------------//


But you have to modify the function


<body>
<div id="mapid" style="width: 700px; height: 560px;"></div>
<script>

Cristobal Navarro
Hay dos tipos de personas: las que te hacen perder el tiempo y las que te hacen perder la noción del tiempo
El secreto de la felicidad no está en hacer lo que te gusta, sino en que te guste lo que haces
User avatar
anserkk
Posts: 1333
Joined: Fri Jun 13, 2008 11:04 am
Location: Kochi, India
Has thanked: 2 times

Re: Plotting locations on Google Maps

Post by anserkk »

Instead of
cnavarro wrote:
<body>
<div id="mapid" style="width: 700px; height: 560px;"></div>
<script>


It would be better to use
<div id="map" style="height: 100%; width: 100%;">
User avatar
vilian
Posts: 985
Joined: Wed Nov 09, 2005 2:17 am
Location: Brazil
Contact:

Re: Plotting locations on Google Maps

Post by vilian »

anserkk wrote:Instead of
cnavarro wrote:
<body>
<div id="mapid" style="width: 700px; height: 560px;"></div>
<script>


It would be better to use
<div id="map" style="height: 100%; width: 100%;">


When I change to this, the map is not shown :(
Sds,
Vilian F. Arraes
vilian@vfatec.com.br
Belém-Pa-Brazil
User avatar
vilian
Posts: 985
Joined: Wed Nov 09, 2005 2:17 am
Location: Brazil
Contact:

Re: Plotting locations on Google Maps

Post by vilian »

cnavarro wrote:Try

Code: Select all | Expand


   MEMOWRIT( cMapFile, cHtmlContent1 + cInitMap + cHtmlContent2 + cAppendStr + cHtmlContent3 )
   CreaWin( cMapFile )

   /*
   oOle := CreateObject( "InternetExplorer.Application" )
   //oOle:bOnEvent  := { | n1, n2, n3 | LeafLetEvent( n1, n2, n3 ) }
   oOle:Width     := 750
   oOle:Height    := 650
   oOle:Visible   := .T.     // Displays the Browser
   oOle:ToolBar   := .F.     // Disables the toolbar
   oOle:StatusBar := .F.     // Disables status bar
   oOle:MenuBar   := .F.     // Disables the menu bar
   oOle:Navigate( cMapFile ) // Open the Webpage
   SysRefresh()
   */

Return nil

//----------------------------------------------------------------------------//

Function CreaWin( cMapFile )

   local oWnd
   local oAct
   local lCancela := .F.
   DEFINE WINDOW oWnd
 
   ACTIVATE WINDOW oWnd MAXIMIZED  ;
       VALID ( lCancela:=.t., .T. ) ;
       ON INIT ( ;
          oAct    := TActiveX():New( oWnd, "Shell.Explorer.2"), ;
          oWnd:oClient := oAct, ;
          oAct:Navigate( cMapFile ), SysRefresh() )

Return nil

//----------------------------------------------------------------------------//


But you have to modify the function


<body>
<div id="mapid" style="width: 700px; height: 560px;"></div>
<script>


IF I'm using with ActiveX, only one mark is shown and I'm inserting two.
Sds,
Vilian F. Arraes
vilian@vfatec.com.br
Belém-Pa-Brazil
User avatar
TimStone
Posts: 2954
Joined: Fri Oct 07, 2005 1:45 pm
Location: Trabuco Canyon, CA USA
Has thanked: 25 times
Been thanked: 2 times
Contact:

Re: Plotting locations on Google Maps

Post by TimStone »

Using your leaflet sample, what command line is adding the shading of the space between the markers ? I only want to display the markers, and not connect them.

In my case, the connecting lines are all over the place, so it looks like a star, rather than just outlining the perimeter of the markers.

Tim
Tim Stone
http://www.MasterLinkSoftware.com
http://www.autoshopwriter.com
timstone@masterlinksoftware.com
Using: FWH 23.10 with Harbour 3.2.0 / Microsoft Visual Studio Community 2022-24 32/64 bit
User avatar
vilian
Posts: 985
Joined: Wed Nov 09, 2005 2:17 am
Location: Brazil
Contact:

Re: Plotting locations on Google Maps

Post by vilian »

Timstone,

To remove the polygon, change this:

Code: Select all | Expand

cAppendStr += "]).addTo(mymap).bindPopup('I am a polygon.');" + CRLF + CRLF


For this:

Code: Select all | Expand

cAppendStr += "]);" + CRLF + CRLF
Sds,
Vilian F. Arraes
vilian@vfatec.com.br
Belém-Pa-Brazil
User avatar
vilian
Posts: 985
Joined: Wed Nov 09, 2005 2:17 am
Location: Brazil
Contact:

Re: Plotting locations on Google Maps

Post by vilian »

Hi guys,
I have been used the code include in this topic for several months, but since yesterday don't work anymore.
I think they made any change on Google Maps. Do you know what was changed ?
Sds,
Vilian F. Arraes
vilian@vfatec.com.br
Belém-Pa-Brazil
Post Reply