Page 1 of 3
TGRAPH Technical Question
Posted: Sun Dec 21, 2014 5:37 pm
by George
Hi,
I would like to display "tool tips" in a graph created with FW Tgraph class. See below a graph sample, created with a different software tool, to illustrate my request.
Here the mouse is over May 2010 Wires Bar.
[url][url=http://postimage.org/]

[/url]
By moving the mouse over a BAR the tooltip would display the information related to that series (ex. information with the X Legend and Y Value associated to it)
I did some testing by integrating the following method into TGRAPH class.
Code: Select all | Expand
METHOD MouseMove( nRow, nCol, nKeyFlags ) CLASS TGraph
   if ::lDrag
      return ::Super:MouseMove( nRow, nCol, nKeyFlags )
   else
      ::oWnd:SetMsg( ::cMsg )        // Many thanks to HMP
      if ::oCursor != nil
         SetCursor( ::oCursor:hCursor )
      else
         CursorIBeam()
      endif

        // Testing
        msginfo(::aSeries[2,1])

      if ::bMMoved != nil
         return Eval( ::bMMoved, nRow, nCol, nKeyFlags )
      endif

//      if ::oBtn != nil
//         ::oBtn:Refresh()
//      endif

   endif

return nil
However the tool tip is displayed as soon the mouse is inside in any position of Graph control.
How can we know when the mouse is over a specific Bar?The graph below is using Fivewin TGRAPH Class
[url][url=http://postimage.org/]

[/url]
Any ideas?
Regards,
George
Re: TGRAPH Technical Question
Posted: Mon Dec 22, 2014 7:02 am
by Antonio Linares
George,
If you review Class TGrap Method Paint() you find this code to paint the bars:
Code: Select all | Expand
   // Bars
   //
   nWBar:=0
   IF Len(::aData[1])=1
      nWide:=nWide*2
      nWBar := (nWide / ( Len(::aSeries) + 1 )) - ::nBarSep
      nPos  := nLeft + ::nBarSep - nDeep + (nWBar/2)
      FOR nJ=1 TO Len( ::aSeries )
         if Len( ::aSeries[nJ] ) > 2
            IF (::aSeries[nJ][3]==NIL .AND. ::nType==GRAPH_TYPE_BAR) .OR.  ::aSeries[nJ][3]==GRAPH_TYPE_BAR
               ::DrawBar(nPos,nZero,::aData[nJ,1]/nMin+nDeep,nWBar,nDeep,::aSeries[nJ][2],1,nJ,::aSeries[nJ][4])
            ENDIF
         endif
         nPos += nWBar + ::nBarSep
      NEXT nJ
   ELSE
      nWBar := nWide - ::nBarSep
      nPos  := nLeft + ::nBarSep - nDeep + (nWBar/2) + 1
      nWBar := ( nWBar / Len(::aSeries) ) - 1
      FOR nI=1 TO Len( ::aData[1] )
         FOR nJ=1 TO Len( ::aSeries )
            IF (::aSeries[nJ][3]==NIL .AND. ::nType==GRAPH_TYPE_BAR) .OR.  ::aSeries[nJ][3]==GRAPH_TYPE_BAR
               ::DrawBar(nPos,nZero,::aData[nJ,nI]/nMin+nDeep,nWBar,nDeep,::aSeries[nJ][2],nI,nJ,::aSeries[nJ][4])
            ENDIF
            nPos += nWBar + 1
         NEXT nJ
         nPos += ::nBarSep
      NEXT nI
   ENDIF
So it seems as nPos and nZero are the coordinates for each bar. You could save nPos and nZero into an array and then check if the mouse is on each bar.
See the definition for Method Drawbar():
METHOD DrawBar( nY, nX, nHigh, nWidth, nDeep, nColor, nI, nJ, l3D )
Re: TGRAPH Technical Question
Posted: Mon Dec 22, 2014 7:52 am
by Antonio Linares
I have placed a trace in this code:
Code: Select all | Expand
      FOR nI=1 TO Len( ::aData[1] )
         FOR nJ=1 TO Len( ::aSeries )
            IF (::aSeries[nJ][3]==NIL .AND. ::nType==GRAPH_TYPE_BAR) .OR.  ::aSeries[nJ][3]==GRAPH_TYPE_BAR
               ::DrawBar(nPos,nZero,::aData[nJ,nI]/nMin+nDeep,nWBar,nDeep,::aSeries[nJ][2],nI,nJ,::aSeries[nJ][4])
               OutputDebugString( Str( nPos ) + " - " + Str( nZero ) + CRLF )  // to review nPos and nZero values
            ENDIF
            nPos += nWBar + 1
         NEXT nJ
         nPos += ::nBarSep
      NEXT nI
and see what I get:
What I don't understand is how nPos is changing in that loop
Re: TGRAPH Technical Question
Posted: Mon Dec 22, 2014 8:00 am
by Antonio Linares
It was in front of my eyes and I was not seeing it

Code: Select all | Expand
      FOR nI=1 TO Len( ::aData[1] )
         FOR nJ=1 TO Len( ::aSeries )
            IF (::aSeries[nJ][3]==NIL .AND. ::nType==GRAPH_TYPE_BAR) .OR.  ::aSeries[nJ][3]==GRAPH_TYPE_BAR
               ::DrawBar(nPos,nZero,::aData[nJ,nI]/nMin+nDeep,nWBar,nDeep,::aSeries[nJ][2],nI,nJ,::aSeries[nJ][4])
            ENDIF
            nPos += nWBar + 1
         NEXT nJ
         nPos += ::nBarSep   // it changes here! :-)
      NEXT nI
Re: TGRAPH Technical Question
Posted: Mon Dec 22, 2014 5:55 pm
by George
Antonio,
I think that a possible solution would be to create an array, in the BAR type case, with the BAR four corner position. Then if the mouse is inside that rectangle display the tooltip.
Do you have any other suggestion?
Regards,
George
Re: TGRAPH Technical Question
Posted: Mon Dec 22, 2014 6:09 pm
by Antonio Linares
George,
yes, that would be the way to go.
You want to show a tooltip when the mouse is over a bar, right ?
I don't remember right now if we can place the tooltip at a certain location. We need to check that.
Re: TGRAPH Technical Question
Posted: Mon Dec 22, 2014 6:59 pm
by George
You want to show a tooltip when the mouse is over a bar, right ?
Yes Antonio. That would be great as the user could see the exact numeric data associated with that bar
Regards,
George
Re: TGRAPH Technical Question
Posted: Tue Dec 23, 2014 7:07 am
by Antonio Linares
George,
I just checked Class TWindow method ShowToolTip( nRow, nCol, cToolTip ) and it supports row and column, so it seems as we have all that we need
Today I have to go out of the office, but I will review it later today.
Re: TGRAPH Technical Question
Posted: Wed Dec 24, 2014 7:50 am
by Antonio Linares
George,
This is an initial version that you may start testing:
In Method Paint these changes are required:
Code: Select all | Expand
   // Bars
   //
   nWBar:=0
   ::aBarCoors = {}   // new !!!
   IF Len(::aData[1])=1
      nWide:=nWide*2
      nWBar := (nWide / ( Len(::aSeries) + 1 )) - ::nBarSep
      nPos  := nLeft + ::nBarSep - nDeep + (nWBar/2)
      FOR nJ=1 TO Len( ::aSeries )
         if Len( ::aSeries[nJ] ) > 2
            IF (::aSeries[nJ][3]==NIL .AND. ::nType==GRAPH_TYPE_BAR) .OR.  ::aSeries[nJ][3]==GRAPH_TYPE_BAR
               ::DrawBar(nPos,nZero,::aData[nJ,1]/nMin+nDeep,nWBar,nDeep,::aSeries[nJ][2],1,nJ,::aSeries[nJ][4])
               AAdd( ::aBarCoors, { nPos, nZero, ::aData[ nJ, 1 ] / nMin + nDeep, nWBar } )  // New !!!
            ENDIF
         endif
         nPos += nWBar + ::nBarSep
      NEXT nJ
   ELSE
      nWBar := nWide - ::nBarSep
      nPos  := nLeft + ::nBarSep - nDeep + (nWBar/2) + 1
      nWBar := ( nWBar / Len(::aSeries) ) - 1
      FOR nI=1 TO Len( ::aData[1] )
         FOR nJ=1 TO Len( ::aSeries )
            IF (::aSeries[nJ][3]==NIL .AND. ::nType==GRAPH_TYPE_BAR) .OR.  ::aSeries[nJ][3]==GRAPH_TYPE_BAR
               ::DrawBar(nPos,nZero,::aData[nJ,nI]/nMin+nDeep,nWBar,nDeep,::aSeries[nJ][2],nI,nJ,::aSeries[nJ][4])
               AAdd( ::aBarCoors, { nPos, nZero, ::aData[ nJ, nI ] / nMin + nDeep, nWBar } )  // New !!!
            ENDIF
            nPos += nWBar + 1
         NEXT nJ
         nPos += ::nBarSep
      NEXT nI
   ENDIF
And add this Method MouseMove()
Code: Select all | Expand
METHOD MouseMove( nRow, nCol, nFlags ) CLASS TGraph

   local nAt := 0

   if ! Empty( ::aBarCoors )
      nAt = AScan( ::aBarCoors,;
         { | aCoors | nRow <= aCoors[ 2 ] .and. ;
                      nRow >= aCoors[ 2 ] - aCoors[ 3 ] .and. ;
                      nCol >= aCoors[ 1 ] .and. ;
                      nCol <= aCoors[ 1 ] + aCoors[ 4 ] } )
      if nAt != 0
         ::ShowToolTip( nRow, nCol, Str( nAt ) )
      else
         ::DestroyTooltip()
      endif
   endif

return nil
Re: TGRAPH Technical Question
Posted: Thu Dec 25, 2014 3:47 pm
by George
Thanks Antonio for your help.
The changes that you did are working fine.
The tooltips, with the nAT variable, are being displayed correctly after adding DATA aBarCoors.
[url][url=http://postimage.org/]

[/url]
The issue now is how to relate each series with their respective value in aBarCoors array as this array containing all values of each series.
I mean if Series “A” has 12 Value and Series ”B” has 12 Value then aBarCoors array will have 24 values.
Regards,
George
Re: TGRAPH Technical Question
Posted: Thu Dec 25, 2014 3:59 pm
by Antonio Linares
George,
In your posted screenshot, instead of 14 what value should be shown ?
Re: TGRAPH Technical Question
Posted: Thu Dec 25, 2014 6:00 pm
by George
Antonio,
The value displayed "14", using your modified code, belong to nAt variable in METHOD MouseMove.
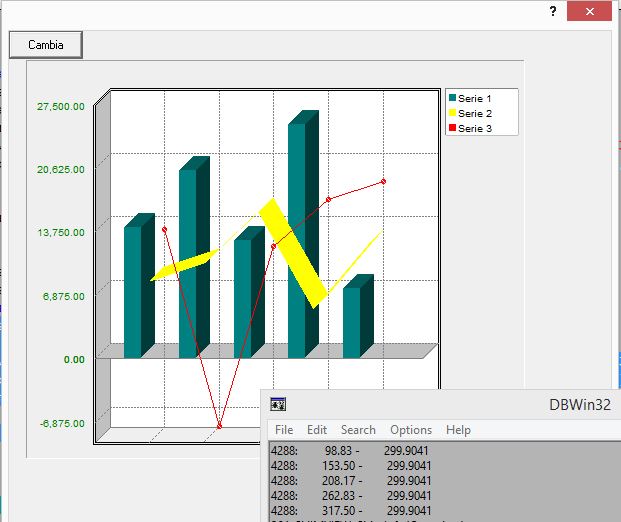
That is helping me to find a solution to my particular case (see graph below).
[url][url=http://postimage.org/]

[/url]
Regards
George
Re: TGRAPH Technical Question
Posted: Thu Dec 25, 2014 8:10 pm
by Antonio Linares
George,
If you post the source code that you are using to build the graph that will help me to implement it
Thanks
Re: TGRAPH Technical Question
Posted: Fri Dec 26, 2014 2:58 am
by George
Antonio,
This is the code that I am using to display tooltips in my particular case of two series values.
I hope that you can develop a general code that can be integrated into TGRAPH.
Regards,
George
Code: Select all | Expand
//---------------------------------------------------
// Data added to display tootips using two series
//---------------------------------------------------
DATA aBarCoors    // Array with Bars coords. added by Antonio Linares
DATA aSeries1     // Array containing Series 1 Value
DATA aSeries2     // Array containing Series 2 Value
DATA cLabelSerie1 // Serie 1 Label
DATA cLabelSerie2 // Serie 2 Label

//------------------------------------------------------------------------------------
METHOD AddSerie( aDat, cLegend, nColor, nType, l3D ) CLASS TGraph
    LOCAL nI
    DEFAULT nType := NIL, ;
        l3D   := NIL

    AAdd( ::aSeries, { cLegend, nColor, nType, l3D } )
    AAdd( ::aData , aDat )
    AAdd( ::aSTemp , { cLegend, nColor, nType, l3D } )
    AAdd( ::aDTemp, aDat )


    //-------------------------------------------------------------
    // Below is the code added to display tootips using two series
    //--------------------------------------------------------------
    IF len( ::aSeries ) = 1   // Series 1
        // Wires Sent
        FOR nX := 1 TO  LEN(aDat)
            aadd(::aSeries1, transform(int(aDat[nX]),  "@B 999,999" ) )
        NEXT
        ::LabelSerie1 := ::aSeries[len( ::aSeries )] [1]
    ELSE  // Series 2
        // Amount Sent
        FOR nX := 1 TO  LEN(aDat)
            // The AMOUNT series (second serie of values in my particular case) was divided by 100
            // in order to be in range of Wires Y Value.
            // Now to display the correct value in the tooltip we need X 100.
            // If we could add other Y Scale value (new TGRAPH feature), to the right of the graph representing the AMOUNT,
            // we don't need to divide the values of serie 2.
            aadd(::aSeries2, transform(int(aDat[nX]*100),  "@B 999,999,999" ))
        NEXT
        ::LabelSerie2 := ::aSeries[len( ::aSeries )] [1]
    ENDIF

RETURN Len( ::aSeries )

//------------------------------------------------------------------------------------
METHOD MouseMove( nRow, nCol, nFlags ) CLASS TGraph // Add by Antonio Linares
    local nAt := 0, nI := 0
    if ! Empty( ::aBarCoors )
        nAt = AScan( ::aBarCoors,;
            { | aCoors | nRow <= aCoors[ 2 ] .and. ;
            nRow >= aCoors[ 2 ] - aCoors[ 3 ] .and. ;
            nCol >= aCoors[ 1 ] .and. ;
            nCol <= aCoors[ 1 ] + aCoors[ 4 ] } )

    //--------------------------------------------------------------
    // Below is the code added to display tootips using two series
    //---------------------------------------------------------------
        if nAt != 0
            //::ShowToolTip( nRow, nCol, Str( nAt ) ) // Added by AL
            if nAt/2 - int(nAt/2) = 0
                // Even
                nI := nAt/2
                ::ShowToolTip( nRow, nCol, ::aYVals[nI] + CRLF+ ::cLabelSerie2 + " = $"+ ::aSeries2[nI]   )
            else
                // Odd
                nI := int(nAt/2)+1
                ::ShowToolTip( nRow, nCol, ::aYVals[nI] + CRLF+ ::cLabelSerie1 + " = "  + ::aSeries1[nI]   )
            endif
        else
            ::DestroyTooltip()
        endif
    endif
return nil
[url][url=http://postimage.org/]

[/url]
[url][url=http://postimage.org/]

[/url]
Re: TGRAPH Technical Question
Posted: Fri Dec 26, 2014 8:43 am
by Antonio Linares
George,
I am doing some tests implementing it as a codeblock so you can show what you want
This is the new code:
Code: Select all | Expand
METHOD MouseMove( nRow, nCol, nFlags ) CLASS TGraph

   local nAt := 0

   if ! Empty( ::aBarCoors )
      nAt = AScan( ::aBarCoors,;
         { | aCoors | nRow <= aCoors[ 2 ] .and. ;
                      nRow >= aCoors[ 2 ] - aCoors[ 3 ] .and. ;
                      nCol >= aCoors[ 1 ] .and. ;
                      nCol <= aCoors[ 1 ] + aCoors[ 4 ] } )
      if nAt != 0
         DEFAULT ::cToolTip := { | nAt | AllTrim( Transform( ::aData[ 1 ][ nAt ],;
                                    "999,999,999.99" ) ) }
         ::ShowToolTip( nRow, nCol, Eval( ::cToolTip, nAt ) )
      else
         ::DestroyTooltip()
      endif
   endif

return nil
Now in your code you can do:
oGraph:cToolTip = { | nAt | Str( nAt ) }
and if you don't set cToolTip then you will get the first series values
Please try it and let me know if it is ok for you, thanks