Page 1 of 1
webview google graph subtitle
Posted: Tue Mar 18, 2025 8:54 pm
by MGA
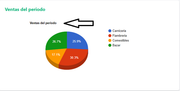
How can I control the title and subtitle of a chart?
When I set title: 'test', the subtitle will have the same value. I would like to be able to configure both.
//part of a function taken from the forum:
cFuncion := cFuncion + " ]);"+;
"var options = { "+;
" title: '"+cTitulo+"',"+;
" hAxis: {title: '" + Alltrim(cHorTitle) + "'},"+;
" vAxis: {prefix:'R$', format: 'R$ #,##0.00', title: '" + Alltrim(cVerTitle) + "'},"+;
" widht: '100%',"+;
" height: 300, "+;
" isStacked: true, "+;
" is3D: " + IIf(lIs3D,"true ","false ")+;
"};"+;
"var chart = new google.visualization."+cTipo+"(document.getElementById('"+cNombre+"'));"+;
"chart.draw(data, options);"+;
"var formatter = new google.visualization.NumberFormat({ prefix: 'R$ ', decimalSymbol: ',', groupingSymbol: '.' }); formatter.format(data, 0); formatter.format(data, 1);"+;
"}"+;
Re: webview google graph subtitle
Posted: Wed Mar 19, 2025 4:09 am
by Antonio Linares
Please post your complete HTML code here
Re: webview google graph subtitle
Posted: Wed Mar 19, 2025 10:29 am
by cmsoft
Re: webview google graph subtitle
Posted: Wed Mar 19, 2025 11:14 am
by MGA
Cesar,
I am basing myself on your code, it is being very useful. Thank you very much.
Cesar, the title provided below is the same as the subtitle, I would like to have a new parameter: cSubTitle
METHOD AddGraph (cNombre, cTitulo, cTipo, aColumnsData, aData, cColor )
METHOD AddGraph (cNombre, cTitulo, cTipo, aColumnsData, aData, cColor )
Local cGraph, cFuncion, cId, i
cGraph := cNombre+'();//AgregarChar'
::cHtml := strtran(::cHtml,"//AgregarChar",cGraph)
cFuncion := "function "+cNombre+"() { "+;
"var data = google.visualization.arrayToDataTable(["+;
" ['"+aColumnsData[1]+"', '"+aColumnsData[2]+"'], "
for i := 1 to len(aData)
cFuncion := cFuncion + "['"+aData[i,1]+"', "+STR(aData[i,2])+"],"
next i
cFuncion := cFuncion + " ]);"+;
"var options = { "+;
" title: '"+cTitulo+"',"+;
" widht: '100%',"+;
" height: 300, "+;
" is3D: true "+;
"};"+;
"var chart = new google.visualization."+cTipo+"(document.getElementById('"+cNombre+"'));"+;
"chart.draw(data, options);"+;
"}"+;
"//FuncionGrafico"
::cHtml := strtran(::cHtml,"//FuncionGrafico",cFuncion)
cId := '<div class="bg-white shadow-md p-6 rounded-lg">'+;
'<h2 class="text-xl font-bold mb-4 text-'+cColor+'-500">'+cTitulo+'</h2>'+;
'<div id="'+cNombre+'"></div>'+;
'</div>'+;
'<!-- idgrafico -->'
::cHtml := strtran(::cHtml,"<!-- idgrafico -->",cId)
return Self
Re: webview google graph subtitle
Posted: Wed Mar 19, 2025 3:59 pm
by cmsoft
Creo que seria algo asi
Code: Select all | Expand
METHOD AddGraph (cNombre, cTitulo, cTipo, aColumnsData, aData, cColor)


METHOD AddGraph (cNombre, cTitulo, cTipo, aColumnsData, aData, cColor,cSubTitulo) // Cambiar aca
Local cGraph, cFuncion, cId, i
cGraph := cNombre+'();//AgregarChar'
::cHtml := strtran(::cHtml,"//AgregarChar",cGraph)
cFuncion := "function "+cNombre+"() { "+;
"var data = google.visualization.arrayToDataTable(["+;
" ['"+aColumnsData[1]+"', '"+aColumnsData[2]+"'], "
for i := 1 to len(aData)
cFuncion := cFuncion + "['"+aData[i,1]+"', "+STR(aData[i,2])+"],"
next i
cFuncion := cFuncion + " ]);"+;
"var options = { "+;
" title: '"+cSubTitulo+"',"+; //Cambiar Aca
" widht: '100%',"+;
" height: 300, "+;
" is3D: true "+;
"};"+;
"var chart = new google.visualization."+cTipo+"(document.getElementById('"+cNombre+"'));"+;
"chart.draw(datos, opciones);"+;
"}"+;
"//FuncionGrafico"
::cHtml := strtran(::cHtml,"//FuncionGrafico",cFuncion)
cId := '<div class="bg-white shadow-md p-6 rounded-lg">'+;
'<h2 class="text-xl font-bold mb-4 text-'+cColor+'-500">'+cTitulo+'</h2>'+;
'<div id="'+cNombre+'"></div>'+;
'</div>'+;
'<!-- idgrafico -->'
::cHtml := strtran(::cHtml,"<!-- idgrafico -->",cId)
return Self
Re: webview google graph subtitle
Posted: Wed Mar 19, 2025 6:18 pm
by MGA
Cesar, thank you very much, your example is being very useful.
