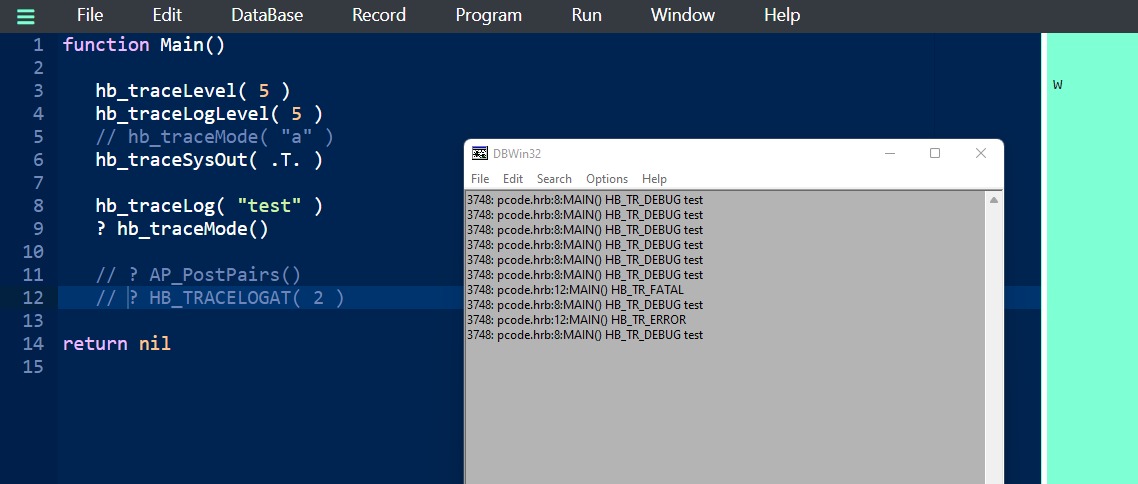
* Once the tracing decribed below is turned on, you can call this
* in a PRG to trace PRG-level function calls:
*
* __TRACEPRGCALLS( <lOnOff> ) --> <lOldValue>
*
* It turns on|off tracing of PRG-level function and method calls.
* The symbol name is written just before it's called.
* This is very useful when debugging GPFs as it
* will trace all PRG-level calls up until the crash.
* Uses HB_TRACE so traces are in line with any C-level traces.
Is someone using it ? thanks
This may help many of us when a GPF suddenly happens

